
Green Energy & Renewables: 2025 Valuation Multiples

For decades, companies have been working towards cost-efficient alternatives to produce Green Energy through sustainable, renewable sources, both in an effort to fight climate change and—more recently—to address energy supply shortages as a consequence of the war in Ukraine.
The sector is currently going through a somewhat contradictory transition phase, breaking investment records year after year—$135bn invested in 2023 per BloombergNEF, triple the 2020 level—while valuations and stock prices have been decreasing since the pandemic.
The reasons for the confusing duality of the Green Energy industry are to be found in both international policy and macroeconomic factors. For years the largest government organisations worldwide, such as the US and the EU are racing to offer the most competitive incentives for clean energy production: the Biden administration signed the Inflation Reduction Act (IRA) in 2022 ushering what’s forecasted to be a decade of a significant portion of public spending being used to finance carbon-efficient energy production, while the EU’s 2023 Green Deal Industrial Plan established €100bn in funding for net-zero wind and solar energy production.
Trump’s second term, however, widely reset expectations in terms of the US’s commitment to their net-zero target, with the 47th President pulling out of the Paris Agreement and instructing federal agencies to freeze their enforcement of Biden’s IRA.
Meanwhile, Green Energy ETFs and indexes have been on the losing side of the market since 2020, when the sector initially boomed. One of the main reason is the high-interest environment that has characterised the post-pandemic macroeconomic outlook. Companies that rely on large initial investments for low-margin long-term profits are the first to suffer when cost of capital rises.
Additionally, supply chain issues paired with low energy prices further slimmed down profit margins for the wind and solar industries, despite producing a whopping 30% combined energy share worldwide in 2023.
Nonetheless, most experts remain optimistic about long-term performance. Mark Lacey, head of global resources as asset management firm Schroders, told Finimize: “while there was euphoria in the sector in 2020, the fall in share prices since then has been healthy and the future is bright for clean energy, given the amount of money that needs to be invested in it.”
Some experts predict that even the US shunning their green energy goals could turn out to be positive for Europe and the UK.
Finesco ETF specialist Fabrizio Arusa told Morningstar: “We believe that the current rise in capital costs is only a temporary setback for the renewable energy sector, as growth prospects in this decade remain strong and financing is still widely available. This creates attractive entry points for the medium to long term.”
The Global X Renewable Energy Producers ETF (RNRG), managed by Mirae Asset Financial Group, “seeks to invest in companies that produce energy from renewable sources including wind, solar, hydroelectric, geothermal, and biofuels.”
The 25 companies in the fund are all listed on public stock exchanges, and so their financial metrics may differ from younger start-ups introducing innovative technologies, typically considered a high-risk-high-reward investment. However, analysing their revenue and EBITDA multiples allows us to establish a benchmark that can be useful to infer the valuation of a private company.
Green Energy Valuation Multiples
Across sectors, we’ve seen a trend of fast-growing multiples throughout 2020 and 2021, when capital was cheap and abundant, followed by a rapid fall throughout all of last year, which caused most companies’ valuations to plummet far below their pre-pandemic levels.
This trend is most evident for Green Energy companies, although the momentum that the sector has enjoyed allowed them to suffer smaller losses than some other sectors.
Revenue multiples for Green Energy companies grew throughout all of 2020, almost doubling from 5.9x in Q1 to 11.1x in Q4 2020 when they reached a peak. Median revenue multiples saw a slow but steady decline in 2021 through all of 2023, with Trump’s victory dealing the final blow at the end of last year. In Q4 2024 the median EV/Revenue multiple for Green Energy companies was 5.7x.
Source: YCharts
The distribution of the multiples across the sample has seen very little skew until 2021, which the top 25% of performers peaking in Q2 2021 and then falling again, with the whole cohort fitting in the 1x – 18x range by the end of 2021, with the median 50% staying between 6.5x and 11.7x.
However, 2022 and 20223 have seen top performers in the cohort extending their lead. By the end of 2025 the top 25% companies in the cohort recorded revenue multiples between 8x and 15x, whereas the remaining 75% ranged from 0.7x to 8x.
Source: YCharts In the chart above, the lines indicate the range of EV/Revenue multiples in our cohorts, while the boxes highlight the Interquartile Range (IQR), which is where the median 50% of the cohort ranks based on their valuation multiple.
In terms of EBITDA valuation multiples, we see a relatively similar trend, peaking at 18.2x in Q4 2020 and then declining slowly back to pre-pandemic levels. While, 2023 seemed to favour those companies that managed to maintain high profit margins, EBITDA multiples saw a sharp decline in 2024, with the median EBITDA multiple for Green Energy companies reaching a 5 year low of 11.1x in Q4 2023.
Source: YCharts
The distribution chart for EBITDA multiples shows much higher variance, with top performers setting themselves apart since 2020 when multiples were still on an upwards trajectory.
Companies with a high degree of differentiation—which use multiple renewable sources to produce Green Energy—such as Canadian producer Innergex, or Renova Inc. in Japan, were able to achieve the highest multiples, consistently being valued over 20x or 30x their EBITDA.
Source: YCharts In the chart above, the lines indicate the range of EV/EBITDA multiples in our cohorts, while the boxes highlight the Interquartile Range (IQR), which is where the median 50% of the cohort ranks based on their valuation multiple.
The information available on this page is of a general nature and is not intended to provide specific advice to any individuals or entities. We work hard to ensure this information is accurate at the time of publishing, although there is no guarantee that such information is accurate at the time you read this. We recommend individuals and companies seek professional advice on their circumstances and matters.
-

Lessons From The UK’s Top 50 Exits
12 November 2025
The most successful founders are those who build a company to be bought, not sold.
Report : Exit and Trends
-
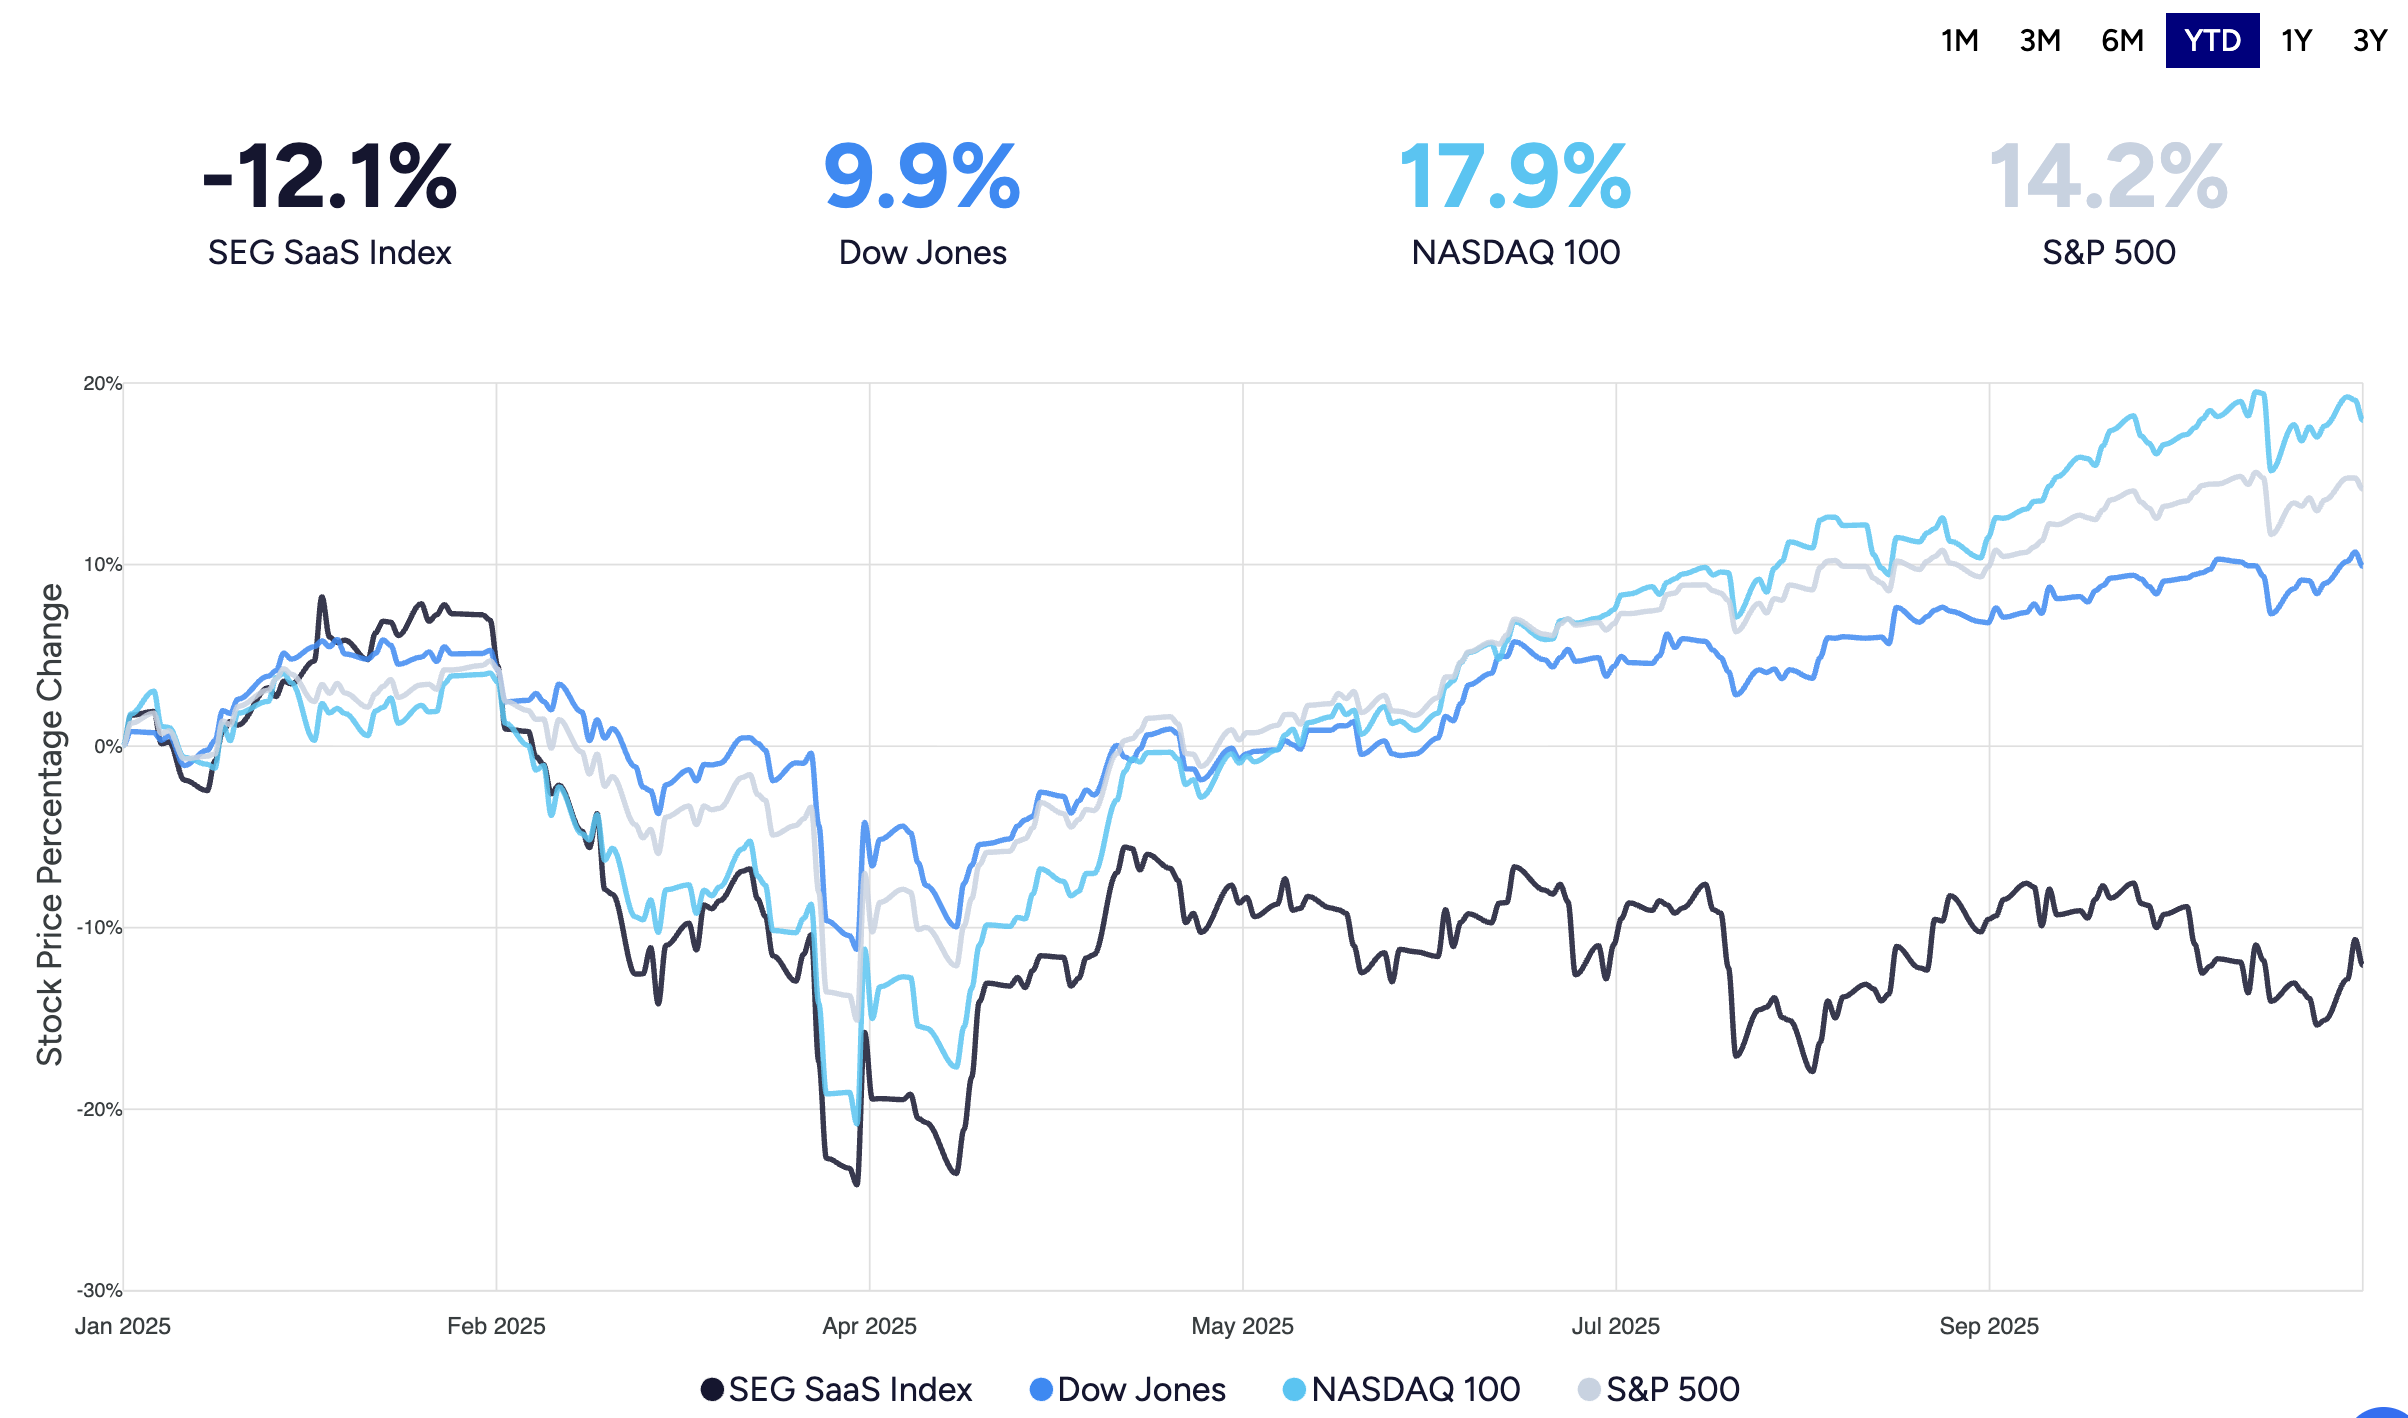
SaaS Stumbles in 2025: End of an Era, or Just Growing Pains?
23 October 2025
There is a widening gap between SaaS and the rest of the market starting in April 2025, and it’s just getting larger and larger.
Report : Tech and Valuation
-
The Jaguar Land Rover Cyber Attack: a £1.9bn Case Study in Systemic Risk
23 October 2025
The Jaguar Land Rover attack highlights several major threats and vulnerabilities in the cybersecurity space.
Report : Strategy and Trends


Sign up for the Founder's Bulletin
Join our community of 4,000 + Founders, Entrepreneurs & Advisors. Refreshingly simple financial insights to help your business soar.
